Last updated: June 11, 2026
Cap Table
Your cap table is the summation of all ownership activity — it shows who owns what. The view adapts based on your entity type.
Corporation vs LLC View
Corporations (C-Corp, Ltd, etc.) use an equity-based model:
- Shareholders own shares
- Cap table shows share counts and ownership percentages
- Option pool is called ESOP (Employee Stock Ownership Plan)
- Funding rounds issue shares at specific valuations
LLCs use a membership-based model:
- Members own units (expressed as percentages)
- Cap table shows unit allocations and membership percentages
- Option pool is called Incentive Unit Pool
- No share-based pricing — ownership is percentage-based
Your entity type is set in Company Profile. The platform automatically uses the correct terminology and calculations throughout.
Understanding the Numbers
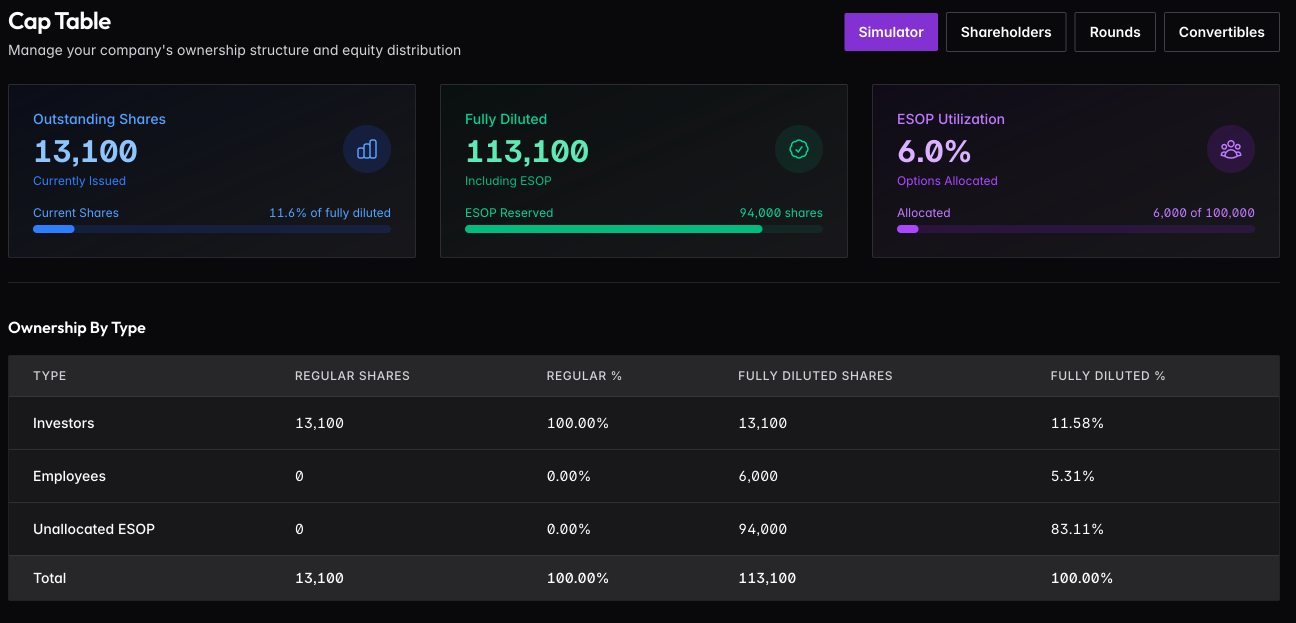
The summary shows three key figures: Outstanding Shares (currently issued), Fully Diluted (issued plus unallocated ESOP), and ESOP Utilization (how much of your option pool has been allocated).
Toggle between Outstanding and Fully Diluted views. Outstanding shows current voting power — shares actually issued. Fully diluted includes your entire option pool, which is how investors think about ownership. When negotiating, always think fully diluted.
Ownership Breakdown
View ownership by investor type (Founders, Investors, Employees) or by share class (Common, Preferred). The pie chart visualizes the distribution; the table shows exact numbers.
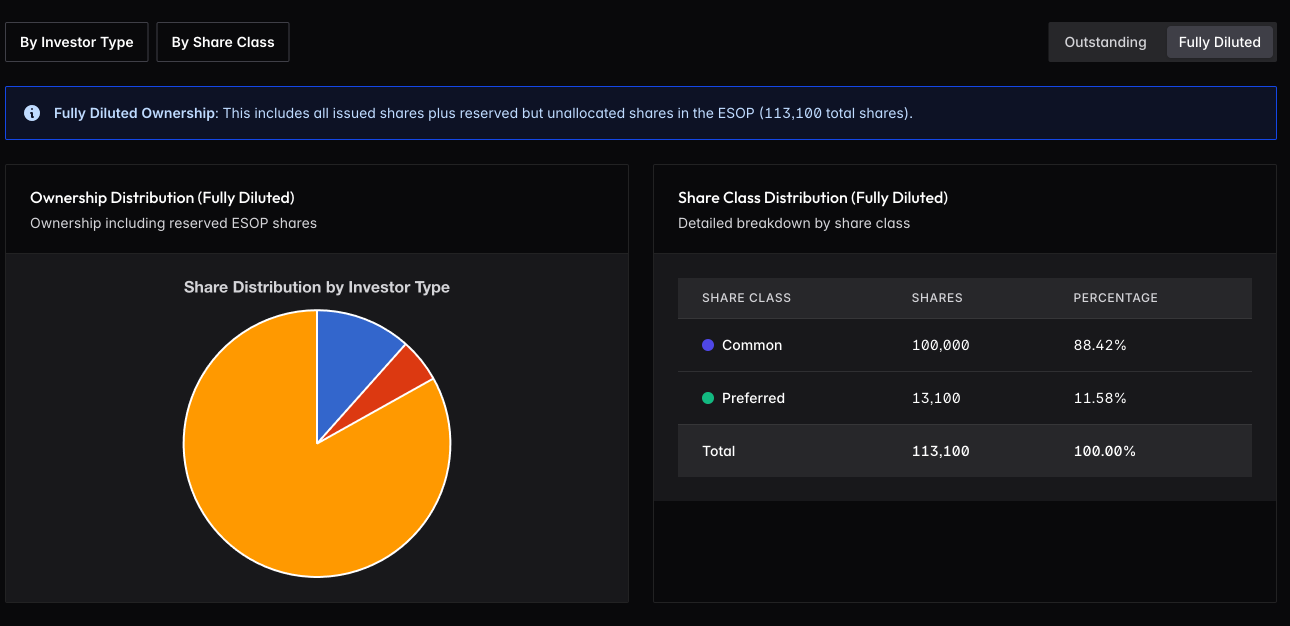
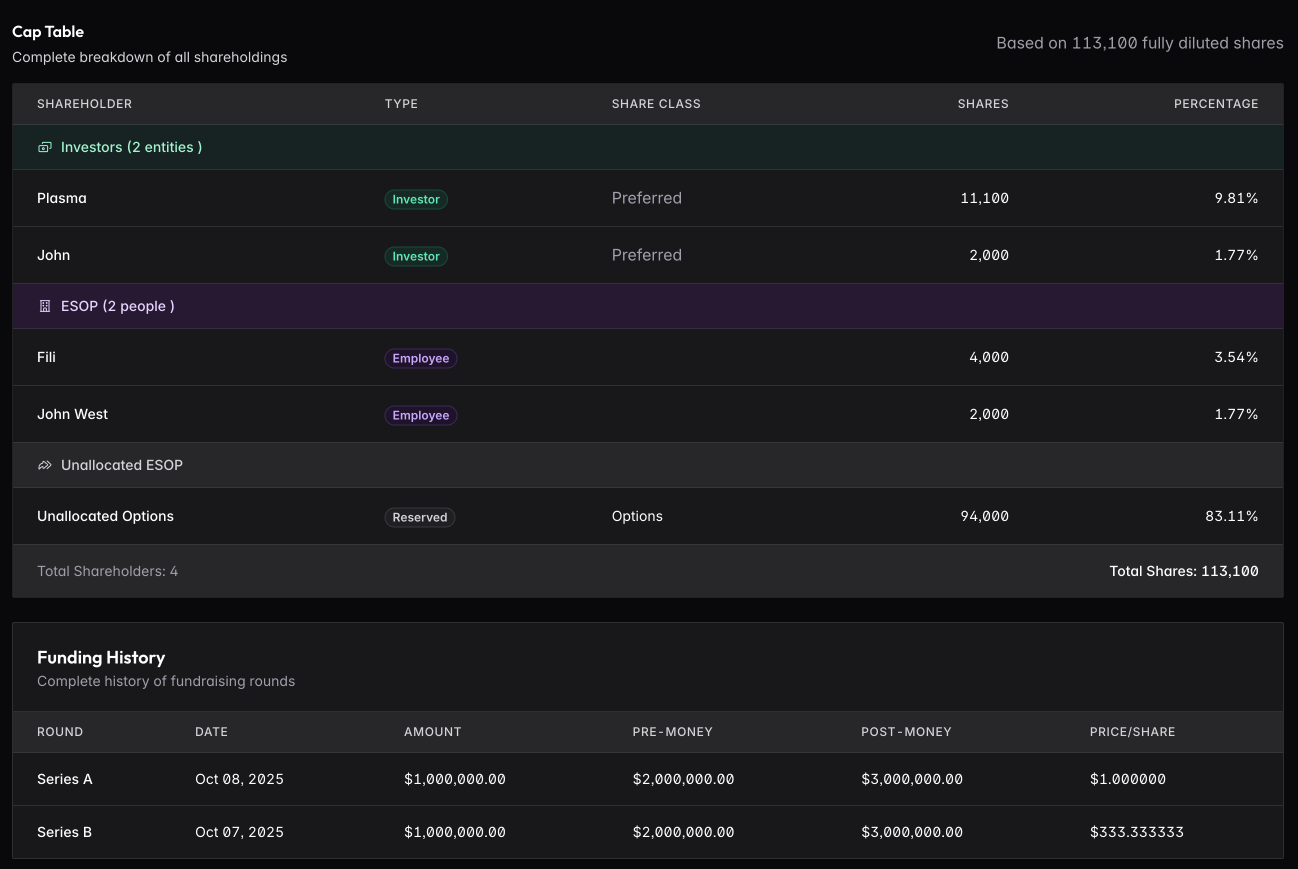
The full cap table lists every shareholder grouped by type, with their share class, share count, and ownership percentage. Funding history shows all rounds with valuations and price per share.
Building Your Cap Table
The cap table itself is read-only — it’s generated from the underlying data. To build it out:
For Corporations:
- Create shareholders — add founders, investors, employees, advisors
- Record funding rounds — document your financing history
- Add shareholdings — link shareholders to rounds with their specific allocations
- Track convertibles — record SAFEs and notes that will convert later
For LLCs:
- Create members — add founders and investors with their unit percentages
- Add membership interests — record each member’s ownership stake
- Track distributions — document profit/loss allocations
Each piece feeds into the cap table automatically.
Converting LLC to Corporation
If you start as an LLC and later convert to a C-Corp (common when raising institutional funding), use the Convert to Corporation feature. This maps your members to shareholders, converts percentages to shares, and switches to the equity-based cap table view. See Company Profile for details.